Medical Billing and Coding Salary by State and Metro (BLS 2025)
Key takeaway: In May 2025 BLS reported a median annual wage of $51,140 for medical records specialists, the occupation that includes billers and coders (OEWS, SOC 29-2072). The 10th percentile was $37,000 ($17.79 an hour) and the 90th was $81,150. State and metro medians range widely. These figures describe the whole occupation. They do not predict what any one person will earn.
Compare this path to the job you have now with the 10th and 25th percentiles, not the median and not the 90th. BLS does not publish pay by credential, by remote vs on-site, or by “new graduate.” When a school quotes a round number with no agency and year, treat it as marketing.
Why the page says medical records specialists
BLS does not publish a medical-coder occupation. In the 2018 SOC revision, billers and coders landed in Medical Records Specialists, SOC 29-2072. When you read a wage here, it blends those jobs at every experience level: a new CPC-A in a two-physician clinic and a CCS with ten years in a hospital. That is not us being coy. That is the federal table. Full explanation: medical records specialist.
If an ad says “coders earn $70,000” with no source, this is why we will not repeat it.
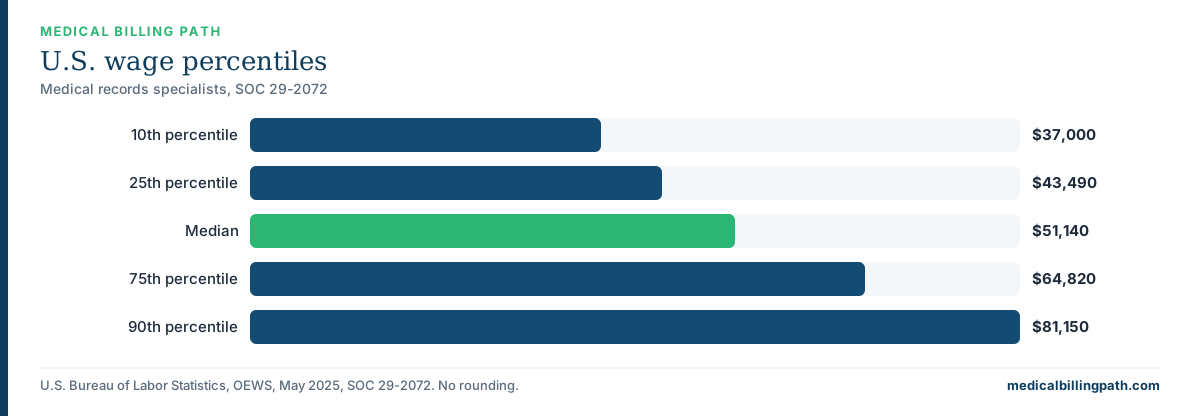
National wage percentiles
View the data behind this chart
| Percentile | Annual wage |
|---|---|
| 10th percentile | $37,000 |
| 25th percentile | $43,490 |
| Median | $51,140 |
| 75th percentile | $64,820 |
| 90th percentile | $81,150 |
A percentile is the wage below which that share of workers fall. Half of the occupation earned less than the median of $51,140 in May 2025. Ten percent earned less than $37,000. Ten percent earned more than $81,150. Employment in the snapshot: 194,720.
| Percentile | Annual | Hourly |
|---|---|---|
| 10th | $37,000 | $17.79 |
| 25th | $43,490 | |
| Median | $51,140 | $24.59 |
| 75th | $64,820 | |
| 90th | $81,150 | $39.01 |
| Mean | $56,790 |
Source: BLS Occupational Employment and Wage Statistics, May 2025, SOC 29-2072, national cross-industry estimates. No rounding. Download the CSV of national, state, and metro wages. Charts on this site are generated from the same file. Embed snippets on each chart link back here.
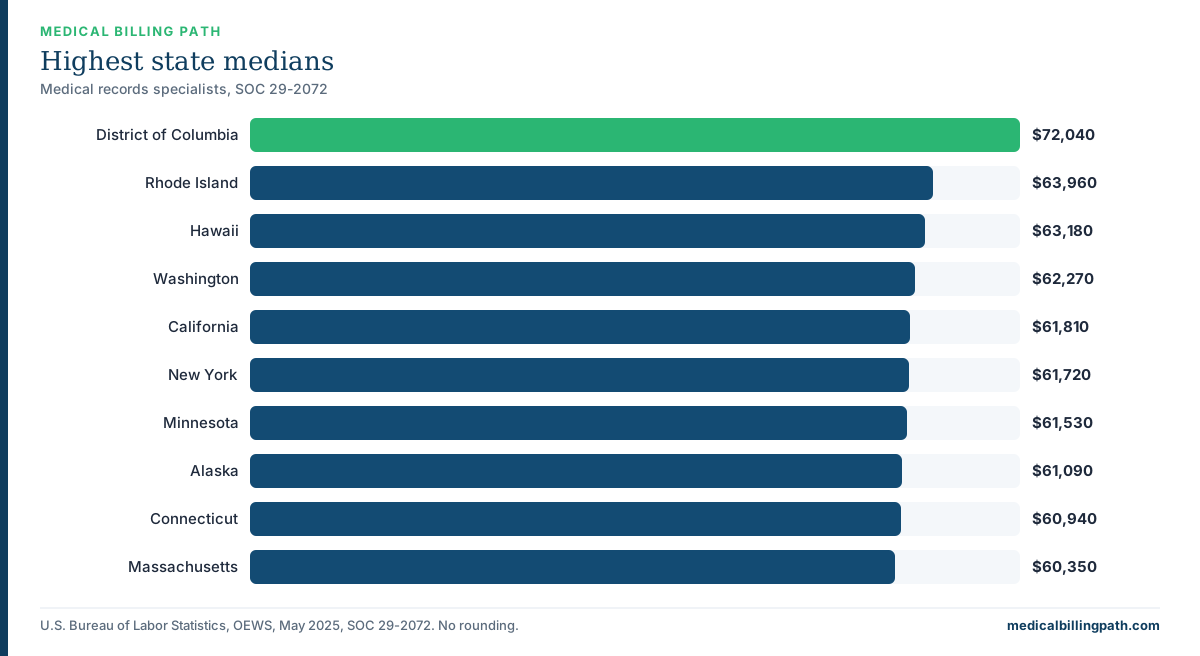
View the data behind this chart
| State | Median annual wage |
|---|---|
| District of Columbia | $72,040 |
| Rhode Island | $63,960 |
| Hawaii | $63,180 |
| Washington | $62,270 |
| California | $61,810 |
| New York | $61,720 |
| Minnesota | $61,530 |
| Alaska | $61,090 |
| Connecticut | $60,940 |
| Massachusetts | $60,350 |
Which number to write down
| Your question | Use |
|---|---|
| Will this beat my current job in year one? | 10th percentile hourly and annual, then your metro 10th |
| What is typical for the occupation? | Median, not the mean |
| What are ads quoting as “up to”? | 75th percentile |
| What does the top of the field look like? | 90th percentile, after years and usually specialty or hospital work |
Write one number from the first row and one from the second. If you only remember the 90th, you are reading the table backwards.
If you are leaving an hourly job
The median is the middle worker, including people with a decade in a hospital coding shop. If you earn $16 an hour now, a 40-hour week for 52 weeks is $33,280 before taxes. Put that next to the 10th percentile annual wage of $37,000 and the 10th percentile hourly wage of $17.79, not next to the median.
The 25th percentile annual wage is $43,490. That is a more honest “if it goes well in a clinic” published proxy than the median. It is still not a promise.
If you already work in a clinic as a medical assistant and you are adding coding, you may land higher than a true beginner because you already read charts. BLS still will not give you a separate number for that. Do not let anyone invent one.
Parents comparing this to overtime on the floor: use your actual overtime year, not the posted hourly. Military spouses: the occupation scale is national, but the metro table is what a local clinic is competing with.
Ads that say “up to $60,000”
They are often quoting the 75th percentile, which is not a starting offer. The 75th percentile in May 2025 was $64,820.
The mean of $56,790 sits above the median because the top end pulls it. Prefer the median and the percentiles. Anyone quoting a remote-only salary without a source is guessing. BLS does not publish wages by work arrangement. See remote medical coding jobs.
Hourly vs annual
BLS publishes both. Annual figures assume full-time year-round work (the usual conversion is hourly times 2,080). If you work 30 hours, do not compare your year to $51,140. Compare your hourly wage to $17.79 and $24.59. If you work overtime on the floor, your current year may already sit above the 10th percentile even when your posted hourly looks low.
Location quotient, employment, and a high wage that hides a small market
State and metro pages show employment and, when BLS published it, location quotient. LQ of 1.0 means the occupation’s share of jobs matches the U.S. share. Above 1.0 means denser. A high median in a metro with a small employment count is a real wage and a thin market. Read both cells. Do not move for a median.
Wages and projections are different vintages
Wages on this page are OEWS May 2025. Openings and growth are Employment Projections 2024-34. Do not mix them into one sentence as if they were the same survey. Outlook: job outlook.
What BLS does not publish (so we do not either)
- Pay by credential (no official CPC salary or CCS salary)
- Pay by experience (“new graduate” or “CPC-A”)
- Pay for remote vs on-site
- A split between billers and coders
- A wage for every city; metros with a suppressed cell show n/a
Industry mix (hospital vs office vs billing company) exists on BLS’s own site for this occupation. We do not copy a figure that is not yet in hugo/data. When it is in the data file, it will be on this page.
What moves pay, as far as the table can say
- Location. State and metro medians differ by tens of thousands of dollars. A high median in a high-cost metro can buy less than a mid median in a cheaper one. We do not publish cost of living. We publish the wage BLS measured.
- Setting. Hospitals and large health systems are generally described as paying more than small practices. That is consistent with BLS industry tables on BLS’s site, not a number we restate here without the file.
- Experience. New coders, including CPC-As, usually start near the lower percentiles.
- Credentials and specialty. Inpatient (CCS-level) and specialty coding are described across the industry as sitting in the upper percentiles. That remains observation, not a BLS split.
How to use a state page
Click your state in the table below. You get that state’s full percentile table against the U.S., a chart of the same cells, a median-vs-U.S. chart, and a list of metros BLS published. Some states suppress a cell when the sample is too small. Those rows show as unavailable rather than guessed.
Vermont is an example in the current OEWS file: some occupation cells are suppressed. The template omits a sentence that would quote a missing number.
How to use a metro page
Open the state, then the metro BLS named. The name is an MSA, not “near me.” Example shape: Houston-Pasadena-The Woodlands, TX, not “Houston area.”
On that page, read three numbers:
- Metro median vs the state median vs the U.S. median of $51,140.
- 10th percentile (annual and hourly if published). That is the starting-pay window.
- 75th percentile. That is closer to what ads mean by “up to.”
The two charts on the metro page are built from those cells. The table under them is the same data in digits. If BLS suppressed the metro, the page says n/a and you use the state. We do not invent a city wage.
Metros with no campus in our school list still appear when BLS published an estimate. Wage coverage follows the OEWS file, not IPEDS.
Median wage by state
| State | Median annual wage | Employment |
|---|---|---|
| District of Columbia | $72,040 | 270 |
| Rhode Island | $63,960 | 650 |
| Hawaii | $63,180 | 400 |
| Washington | $62,270 | 5,010 |
| California | $61,810 | 18,700 |
| New York | $61,720 | 9,080 |
| Minnesota | $61,530 | 3,150 |
| Alaska | $61,090 | 1,070 |
| Connecticut | $60,940 | 1,120 |
| Massachusetts | $60,350 | 3,500 |
| Wisconsin | $60,280 | 2,870 |
| Colorado | $59,020 | 1,780 |
| Oregon | $59,000 | 2,560 |
| Vermont | $57,560 | n/a |
| New Mexico | $57,470 | 1,400 |
| Illinois | $56,440 | 5,740 |
| Delaware | $56,060 | 610 |
| South Carolina | $54,280 | 2,750 |
| Maryland | $54,220 | 2,440 |
| Wyoming | $54,210 | 280 |
| Idaho | $53,460 | 1,490 |
| Oklahoma | $53,460 | 2,480 |
| Virginia | $53,290 | 4,630 |
| Utah | $52,870 | 1,910 |
| Maine | $52,090 | 1,000 |
| Nebraska | $51,670 | 1,640 |
| South Dakota | $51,610 | 900 |
| Georgia | $51,550 | 5,930 |
| Ohio | $50,990 | 7,440 |
| Missouri | $50,750 | 3,890 |
| Iowa | $50,640 | 2,250 |
| Nevada | $50,300 | 2,350 |
| New Jersey | $50,240 | 4,450 |
| Montana | $50,190 | 820 |
| North Carolina | $49,620 | 6,760 |
| New Hampshire | $49,210 | 930 |
| Texas | $48,860 | 17,210 |
| Tennessee | $48,780 | 4,440 |
| Kentucky | $48,410 | 4,210 |
| Kansas | $48,160 | 2,030 |
| Michigan | $48,120 | 4,890 |
| Indiana | $47,670 | 5,860 |
| Arizona | $47,630 | 3,750 |
| West Virginia | $47,360 | 1,260 |
| Pennsylvania | $46,840 | 6,970 |
| North Dakota | $46,280 | 520 |
| Florida | $45,760 | 21,490 |
| Louisiana | $44,610 | 2,600 |
| Alabama | $43,810 | 2,330 |
| Arkansas | $41,740 | 1,920 |
| Mississippi | $41,500 | 2,310 |
Source: U.S. Bureau of Labor Statistics, OEWS, May 2025, SOC 29-2072.
Click any state for percentiles, metro list, and a link to that state’s schools. Figures are BLS OEWS May 2025, SOC 29-2072.
What is in the CSV
The download is national, every state, and every metro BLS published for this occupation in May 2025: employment, median, mean, percentiles, hourly where present, location quotient. Public-domain BLS data, compiled here without rounding. Cite BLS and the May 2025 vintage if you reuse it. Chart embeds on this site include a link back to the page they came from.
A five-minute exercise before you enroll
- Write down what you earn now, hourly if you can.
- Write down the 10th and 25th percentile wages on this page ($17.79 an hour; $43,490 a year).
- Open your state, then your metro if it exists. Write the metro 10th.
- Write down a school’s total published program price, including manuals (program cost).
- Decide whether the gap is worth the months of study. Is it worth it walks the non-money trade-offs (CPC-A, on-site first year, kids, moving).
That is a payback sketch you finish yourself. We will not fill in line one and call it a guarantee.
Salary by state
- AlabamaState and metro wages for medical records specialists.
- AlaskaState and metro wages for medical records specialists.
- ArizonaState and metro wages for medical records specialists.
- ArkansasState and metro wages for medical records specialists.
- CaliforniaState and metro wages for medical records specialists.
- ColoradoState and metro wages for medical records specialists.
- ConnecticutState and metro wages for medical records specialists.
- DelawareState and metro wages for medical records specialists.
- District of ColumbiaState and metro wages for medical records specialists.
- FloridaState and metro wages for medical records specialists.
- GeorgiaState and metro wages for medical records specialists.
- HawaiiState and metro wages for medical records specialists.
- IdahoState and metro wages for medical records specialists.
- IllinoisState and metro wages for medical records specialists.
- IndianaState and metro wages for medical records specialists.
- IowaState and metro wages for medical records specialists.
- KansasState and metro wages for medical records specialists.
- KentuckyState and metro wages for medical records specialists.
- LouisianaState and metro wages for medical records specialists.
- MaineState and metro wages for medical records specialists.
- MarylandState and metro wages for medical records specialists.
- MassachusettsState and metro wages for medical records specialists.
- MichiganState and metro wages for medical records specialists.
- MinnesotaState and metro wages for medical records specialists.
- MississippiState and metro wages for medical records specialists.
- MissouriState and metro wages for medical records specialists.
- MontanaState and metro wages for medical records specialists.
- NebraskaState and metro wages for medical records specialists.
- NevadaState and metro wages for medical records specialists.
- New HampshireState and metro wages for medical records specialists.
- New JerseyState and metro wages for medical records specialists.
- New MexicoState and metro wages for medical records specialists.
- New YorkState and metro wages for medical records specialists.
- North CarolinaState and metro wages for medical records specialists.
- North DakotaState and metro wages for medical records specialists.
- OhioState and metro wages for medical records specialists.
- OklahomaState and metro wages for medical records specialists.
- OregonState and metro wages for medical records specialists.
- PennsylvaniaState and metro wages for medical records specialists.
- Rhode IslandState and metro wages for medical records specialists.
- South CarolinaState and metro wages for medical records specialists.
- South DakotaState and metro wages for medical records specialists.
- TennesseeState and metro wages for medical records specialists.
- TexasState and metro wages for medical records specialists.
- UtahState and metro wages for medical records specialists.
- VermontState and metro wages for medical records specialists.
- VirginiaState and metro wages for medical records specialists.
- WashingtonState and metro wages for medical records specialists.
- West VirginiaState and metro wages for medical records specialists.
- WisconsinState and metro wages for medical records specialists.
- WyomingState and metro wages for medical records specialists.